


There is a curious anomaly that has dogged all of the nuclear tests in South Asia (including Pakistan) since the first Indian test in 1974. The reported yields of these tests have consistently exceeded the yields as estimated by the data available to outside observers.
The first Indian test - Pokhran I or "Smiling Buddha" - was originally reported by the Indian AEC (Atomic Energy Commission) Chairman Homi Sethna on the day of the test to have had a yield of between 10 and 15 kilotons. Subsequently nearly all reports described the yield as 12 kilotons, or 12 to 15 kilotons [Perkovich 1999, p. 181] (and occasionally as high as 15 to 20 kilotons, [Perkovich 1999, p. 522]). In a paper presented to the IAEA in January 1975 Ramanna and Chidambaram placed the yield at 12 kilotons. Official reports following the 1998 Shakti test series have repeated this figure, or nudged it up to 13 kilotons.
On the other hand, other reports over the years have placed the yield much lower. U.S. analysts have estimated the yield as 4 to 6 kilotons [Wallace 1998, p. 3] (or go to his on-line reprint), and Indian journalists have published reports of yields as low as 2 kilotons.
Two former chairmen of the AEC have conceded in interviews that the test yield was lower than the official 12 kt figure [Perkovich 1999, p. 182]. Sethna stated in 1996 that "the yield was much lower than had been stated". P.K. Iyengar has repeatedly cited a yield range of 8-10 kt, though seeming to favor yields ranging from 8 to approaching 10 (but never as high as 10) at different times. In [Perkovich 1999] he is cited as offering a figure of 8-10 kt (further elaborating that the design yield was 10 kt). In [Albright 1998a] Iyengar says that based on a radiochemical analysis of samples of bomb debris taken from the shaft, the yield of the 1974 shot was closer to 10 than eight kilotons. In [Douglas et al 2001; p. ] (quoting from Gupta, V. and Pabian, F., Sci. Global Security, 1996, 6, 101-189) he is cited as saying that the yield was 8 kt ‘exactly as predicted’. Since Iyengar was second-in-command of the development and test program for Pokhran-I, as well as AEC Chairman later, and this statement contradicts official figures, his opinion on this must be accorded significant weight. The Indian government has never released the results of radiochemical tests that would give unambiguous evidence of yield.
Wallace estimates the yield of Pokhran-I both directly from the seismic signal generated by the test (a body wave magnitude of Mb4.9), and by comparing the crater features to U.S. descriptions of crater morphology for various underground test conditions. The basic yield-to-seismic magnitude relationship is given by Equation 1:
In estimating the yield from test crater features Wallace points to the clear fissures seen around the crater, and in the upper part of the crater as evidence that the underground explosion was deep enough relative to yield to completely contain the blast and produce an underground void, leading to a subsidence crater when this void collapsed. Craters of this kind usually have fissures caused by tension when the soil subsides. Using the 107 m (351 ft) detonation depth provided by India, and a U.S. scaling formula used for determining the burial depth to guarantee complete containment at the Nevada Test Site:
The formulas for making yield estimates from seismic signals span a range greater than a factor of 4 [Barker et al 1998; p. 1968], raising the question of whether the formula chosen by Wallace was necessarily appropriate. This author cannot judge whether the formula is appropriate for the tectonic conditions of Pokhran, but from Wallace's own report it appears that it is actually on the low end of available formulas (the extreme low value for the formulas given by Wallace would make Pokhran-I a 3.2 kt yield). Even this extreme low yield is much higher than the yield estimate implied by Wallace's interpretation of the crater evidence (about one kiloton or less). Curiously Wallace chooses to describe this divergent estimate as "very consistent with the seismic estimates of yield", by arbitrarily promoting it to "<5 kilotons" so that it overlaps the seismic estimates. But Wallace's interpretation of the crater features is not valid, being based on several erroneous beliefs.
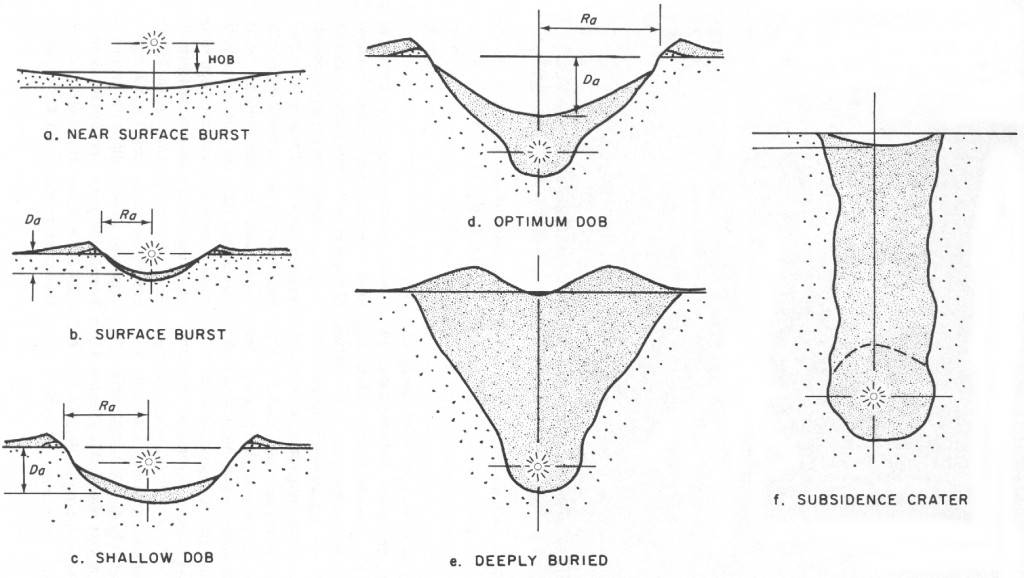
In a shallow underground explosion the cavity formation goes through phases as depicted in [Teller et al 1968, p. 143]:
Images made only moments after the shot was fired (which match verbal accounts by witnesses) show that the test was too large to be fully contained -- that is, no significant surface disturbance prior to subsidence collapse. In this image we see the uplift mound thrown up briefly by Pokhran-I. Descriptions of this test by the scientists involved [Chengappa 2000, p. 198-200] also recount this phenomenon. Studying the images of this crater show that is has an unusual complex set of features, not comparable to any other underground nuclear test this author has been able to find. The crater proper, which contains fissures characteristic of settling and subsidence as Wallace observed, is surrounded by fissures and uneven broken ground stretching well away from the crater perimeter. These fissures were presumably created by stretching when the mound was heaved upward. Images of subsidence craters at the Nevada Test Site available to this writer entirely lack the pronounced fissures surrounding the outside of the crater that are so striking in images of Pokhran-I. In the NTS images of pure subsidence craters, the fissures are confined to the crater interior (see the Storax and NTS underground test pages for examples). On the other hand, clear evidence of ejecta - material thrown from the crater - is impossible to find in the pictures. Taken together these indicators show that the blast, though apparently contained, was only very marginally so. The upheaval was either not quite violent enough to actually break through and create a "throw out crater" (the typical blast-type crater), or if it did break through it was without sufficient force to throw material out of the crater. All of the material propelled upward remained within the crater. These phenomena match the craters shown here with burial depths of 175 (equivalent to diagram e. in this figure) or 200 feet (no equivalent in the Glasstone crater figure), not 350 feet. Clearly, if the yield had been significantly greater an obvious surface rupture with ejecta would certainly have occurred. The wide shallow crater produced (reportedly it had a 47 m radius and was 10 m deep; recent high resolution commercial satellite imagery indicates a crater radius of 60 m) is also characteristic of a marginal cratering explosion rather than a contained subsurface detonation. True subsidence craters have dimensions similar to the underground cavity, which for this yield range would be a radius of 30 m or less. The fact that this explosion marks a transition between surface and subsurface explosions accounts for its unusual distinctive and complex structure.
As is explained in "Scaling Laws" applying scaling laws to analyze shot effects in the regime that transitions between surface cratering and subsurface containment is difficult since the scaling laws themselves are changing (from a 1/3.4 exponent law for cratering explosions to a 1/3 law for contained cavity-producing explosions) and the exact physical properties of the media in which the shot is fired also alter the effects observed. The 1/3 law applies only to fully contained explosions, ones in which the energy of the the explosion is entirely expended in three dimensions in creating an underground cavity. The additional energy expended in lofting material against the force of gravity when the explosion breaches the surface leads (when full cratering effects are observed) to the 1/3.4 law.
Based on the surface effect diagram he uses, Wallace expects that a shallowly contained explosion would necessarily produce a permanent "retarc" (a mound of rubble - this is "crater" spelled backwards and is the actual terminology used). But the formation of a retarc is not general behavior - it is dependent on the characteristics of the medium in which it is fired, and the characteristics of any overburden that may be present (see The Effects of Underground Explosions for a detailed discussion of the issues). Retarcs only occur if the shot is fired in a medium that bulks up when shattered by the explosion, and can hold the mounded form as occurred in granite and basalt with the Whetstone Sulky shot at NTS (18 December 1964). Retarc formation is also rather sensitive to the depth of firing - in fact Sulky is the only retarc formed in the entire history of US nuclear testing. A relatively deep shot produces greater bulking because the rock is broken into large blocks with a greater amount of void between them. A shallow detonation produces higher stresses and smaller particles with low bulking even in a bulking-prone medium [Teller et al 1968, p. 88]. And if the shot is instead fired in a stratum that becomes compacted to the sides and below by the explosion (creating a cavity), but is overlaid with material that does not bulk up substantially from the explosion, then an uplift mound followed by a subsidence cavity is exactly what would be expected - but the phenomenon involved are rather different from the permanent cavity formation, followed by chimney formation progressively climbing to the surface seen in "classic" subsidence craters. This appears to be the situation with Pokhran-I.
The strata in which Pokhran-I was fired is described as being dry sandstone and shale above the water table ([Douglas et al 2001], quoting Chidambaram and Ramanna from Some studies of India’s peaceful nuclear explosion experiment, Proc. Tech. Committee on Peaceful Nuclear Explosions IV, IAEA, Vienna, 1975, pp. 421-427). From the available descriptions that are available about the shaft digging operations at Pokhran, it is clear that while the test shaft may have been above the water table, it was plagued by continual seepage and flooding, so that the porous moisture bearing rock is perhaps similar to the tuff at NTS. But the surface of the Pokhran site is clearly covered by a layer of sand - a material that does not bulk at all, and efficiently fills subsurface voids. It may also be that below the sandy surface of this area of the Thar Desert there is a layer of alluvium - a loose material that also does not bulk. Also the obviously shallow depth of the detonation would have shattered the rock overburden into small pieces reducing or eliminating bulking in any material prone to it. Thus the formation of a subsurface partial cavity, a temporary uplift mound, followed by cavity collapse and permanent subsidence crater formation in entirely consistent with an explosion that was large enough to be only marginally contained.
Using this understanding to calibrate the yield is complicated by the scaling problems noted above. But by marshalling the available data on deep cratering experiments done for Plowshare a tight boundary on the yield can be obtained.
Sulky provides the closest analogy to Pokhran-I in the US nuclear test program. This shot was a hard rock deep cratering test that was marginally contained - it failed to throw out any material, but it did rupture the surface. As
A Plowshare shot that provides another constraint on conditions for containment is Palanquin which was a 4.3 kt shot fired in hard dry rock (rhyolite) at a depth of 85.7 m. Palanquin was a deep cratering shot that excavated a 73 m by 24 m crater with an ejecta boundary extending 82 m from the center [Gibson 1965; pg. 8] (for a contemporary satellite image of the Palanquin crater located at 37.280 -116.524 click here). This gives a scaled depth for Palanquin ranging from 52.7 to 55.8 m. The dimensions of Palanquin can be compared to the dimensions of Pokhran-I, 94 m by 10 m. The generally similar wide shallow form of the two craters suggest a similarity in their mechanism of formation. If scaled to the depth of Pokhran-I using the 1/3.4 law Palanquin would have a yield of 9.1 kt. If the rock in which Pokhran-I was fired matched the dry rhyolite of Palanquin in containment strength, this immediately establishes an easy upper limit to P-I's yield
| Comparison of Deep Cratering Shots Scaled with the 1/3.4 Law | ||||||
|---|---|---|---|---|---|---|
| Test Name | Date | Yield (kt) | Depth (m) | Radius (m) | Scaled Depth (m) | Scaled Radius (m) |
| Sulky | 12/18/64 | 0.092 | 27.1 | 12 | 54.7 | 24.2 |
| Palanquin | 04/14/65 | 4.3 | 85.7 | 36.5 | 55.8 | 23.8 |
| Pokhran-I (Iyengar est.) | 74 | 8.0 | 107 | 47 | 58.0 | 25.4 |
| Cabriolet | 01/26/68 | 2.2 | 51.8 | 61 | 41.1 | 48.4 |
| Schooner | 12/08/68 | 30 | 111.3 | 130 | 40.9 | 47.8 |
Milo Nordyke discovered that if the various hard rock cratering shots conducted for Plowshare (both conventional and nuclear) were scaled with the 1/3.4 law used for throw-out craters, and the scaled depths and radii plotted, a well defined curve resulted. Figure 1 below is adapted from one by Nordyke which appears in [Teller et al 1968, p. 197]. The graph plots cratering results for basalt and has been altered by adding data points for an additional Plowshare cratering shot (Palanquin), and also the positions for Pokhran-I scaled for 8 and 13 kt. In addition the data point for Sulky has been replotted. The original data point gives it a "zero radius". The thinking for plotting it this way was no doubt that since it wasn't defined as a crater, it couldn't have a "crater radius". However it did produce a surface rupture of considerable size, which missed being a depression simply due to the upper strata's failure to recompact. If the graph is considered a plot of surface rupture features of all types, then Sulky should be plotted at the position labelled "actual". (Note also, the original diagram placed Sulky slightly too high on the depth scale.)
 Click here to see 640x530 version (20 k) |
| Figure 1. Scaled Depth vs Radius for Cratering Shots. |
|---|
 |
It can be seen in Figure 1 that Sulky and Palanquin occupy almost the same spot on the graph, with Sulky being located slightly farther from the crater vs radius curve.
In looking for reasons that two shots with almost identical scaled characteristics produced quite different surface effects it should be noted that they are falling on opposite sides of the point of containment, but just barely. Sulky was fired in a notably strong rock - granite - which would be expected to cause rather better containment than basalt. The rhyolite used for Palanquin is a strong hard rock (it has the same chemical composition as granite but with a finer crystal structure), probably stronger than basalt but not quite as strong as granite. Thus both shots should be expected to fall slightly below the scaled radius curve for basalt (i.e. smaller radius for the same scaled depth) due to better containment in stronger rock. Also the fact that Palanquin produced a throw-out crater while Sulky did not, even if it was slightly deeper, is explicable given the stronger rock used with Sulky. The scaled depth difference between Sulky and Palanquin (1.1 m) is so slight though, that they are virtually the same, being smaller than the scaling uncertainty introduced by the uncertainty in yield.
But the fact that these two shots - with a 47-fold yield difference - tightly bracket the threshold conditions for containment places tight constraints on the plausible yield for Pokhran-I. It can be seen that with an 8 kt yield Pokhran-I clusters closely with Sulky and Palanquin. Pokhran-I was slightly deeper than Palanquin and was barely contained, suggesting that the rock in which it was fired was roughly similar in strength to the rhyolite of Palanquin.
On the other hand the claim of 13 kt puts Pokhran-I in a strikingly anomalous position. It is much farther below the curve than any over the other shots, and at a much shallower scaled depth than the evident cutoff region for containment. In effect this requires Pokhran-I to have been fired in rock with remarkable properties - offering far better containment than basalt, rhyolite, or granite. The actual test site rock (sandstone and shale) was soft, porous and moisture bearing - quite significantly weaker than the granite strata in which Sulky was emplaced. Chidambaram asserts that rock mechanics calculations employing measurements of the physical properties of the Pokhran rocks support the 13 kt yield for Pokhran-I [Sikka et al 2000]. With due respect to Chidambaram, in light of the scaling data presented here this is an extraordinary claim, and is impossible to credit.
From this analysis, it appears that the yield of Pokhran-I has been tightly constrained to value close to 8 kt, in accordance with recent statements made by PK Iyengar.
Palanquin deposited 5% of its fission products as local fallout [Gibson 1965; pg. 45], and produced a peak post-shot radiation field exceeding 1000 R/hr, and with lethal 500 R/hr levels extending a mile downwind. It has been reported ([Chengappa 2000; p. 187]) that Chidambaram had calculated that the test depth should be 107 m to contain radiation from the shot, and by mid-1973 had passed this specification to Indian Army which was charged with the task of sinking the shaft. Since Chadambaram presumably consulted the Plowshare test results (Palanquin was conducted 14 April 1965), he would have been aware that a shot that scaled to Palanquin would be very unlikely to be contained. Thus if Chidambaram really planned complete, or nearly complete containment, a planned yield would have had to have be no more than 9 kt, and very likely less.
The 8 kt yield range suggested by comparison with US cratering data is well within the range that seismic scaling laws provide - which extends from 3.2 kt to as high as 21 kt for a mb of 4.9 (though not all yields in this range are equally plausible), and matches some values given by Iyengar. It is significantly higher than estimates favored by seismologists for Pokhran, and the reported estimates of U.S. analysts, but is well within the uncertainties characteristic of seismic yield estimation.
The yields claimed for the initial simultaneous Shakti I-III three shot test on 11 May were 43 kt, +/- 3 kt (for a thermonuclear device test, also stated to be 43-45 kt), 12 kt (an improved fission bomb design), and 0.2 kt. As with Pokhran-I, these yield claims have been controversial from the start.
Three approaches exist for estimating yield from the seismic data:
Problems specific to the first approach is accounting for all the variables that influence the apparent signal produced by a given yield. These include coupling of the explosion to the medium surrounding it, local signal propagation in the test area, and long distance signal propagation to the measuring site. As noted above the relationship between a measured signal and the actual yield can vary over a factor of at least 6, even if no unusual coupling factors are involved.
Both the second and third approaches are plagued by uncertainties regarding the yield of P-I which make it problematic as a basis of estimating P-II. In addition the second method shares some of the problems of the first with accounting for variables that affect apparent yield, and also must deal with additional sources of error from computing seismic yields for both P-I and P-II separately. The third method has fewer uncertainties to deal with, but is limited by the small number of seismic stations that recorded both tests. Only data from measuring stations that directly measured both tests can be used.
Common problems to all methods include questions about whether coupling was equal for all shots, and the complications in measurement and interpretation created by the multiple shots fired in P-II.
Most seismic estimates of Pokhran-II, and all non-Indian estimates, are teleseismic estimates - that is, computed using measurements made at long range. These depend on body wave magnitude (Mb) estimates which utilize the P-wave (compression wave) signal detectable globally, and are made with seismographs that measure the energy in the P-wave signal over a frequency range of 0.1-3.0 Hz. The body wave magnitude is not detectable directly, but must be calculated from a formula that adjusts for factors like range and source depth. An additional formula must then be applied to calculate yield from magnitude.
The consensus magnitude for Pokhran-II is mb 5.2, measured by the USGS, the PIDC, and other researchers. Most direct seismic yield calculations give values for Pokhran-II have been sharply lower than the official values, typically one-third up to one-half (at most) of the claimed yields. Wallace calculates yield from the mb 5.2 estimate using his preferred scaling formula yielded a range of only 10-15 kt (preliminary data analysis shortly after the tests had produced estimates of the combined yield ranging from 15 to 25 kt).
The initial Indian report on seismic measurements for the 11 May tests was made on Wednesday 13 May. As reported by Agence-France Presse (AFP) and the Press Trust of India (PTI), Indian seismologists connected with the BARC, but apparently not directly connected with the nuclear tests, claimed that measurements by the Gauribidanur Seismic Array Station (designated GBA) gave a yield estimate of 55 kilotons, the same as the official figure reported later. According to BARC Scientific Officer Ranganath Bharthur in a press release, the station recorded the test at 15:47:07 hours (10:17:07 UCT) on May 11.
Curiously however, the actual magnitude measured by GBA was mb 5.2, the same as the USGS figure. BARC scientists later implicitly conceded, in [Sikka et al 1998a], that this measurement did not support a claim of 55 kt, either by scaling from the Pokhran-I test or by direct estimation using yield formulas, because in this paper they found it necessary to apply a 'correction' formula to the GBA measurement to boost it to mb 5.4. Using this higher figure (which corresponds to a 1.6 fold yield increase), and the official Pokhran-I yield of 13 kt for comparative yield estimation (which is also a factor of 1.6 too high) they support the originally reported yield of 55 kt, rather than the 24 kt upper limit obtained by others. They also claim that only the highest reported mb measurements from around the world are accurate, and apply (different) corrections to the others (like the USGS measurement) to bring them into line with their claim of a real value of mb 5.4. Seismic measurements made at different sites typically have a range of measured values (like any scientific measurement), and normal procedure is to take their average (which gives a value of about 5.2).
The P-II tests were unusual. There have been few, if any, other shots conducted with simultaneous firings separated horizontally by distances on the order of 1 km. The experience base for deciding what effects whould alter measurements in this circumstance is slim, relying mostly on consideration of the underlying principles involved.
The correction procedure employed by Sikka et al is based on the destructive interference between the waveforms of the two principal P-II shots, Shakti-I and II (S-I and S-II), fired simultaneously in separate boreholes 1 km. Destructive interference would reduce the energy radiated in particular directions, thus reducing the seismic signal, while constructive interference would enhance it. They argue that since the line joining the boreholes was oriented roughly E-W, that for stations to the north (or south) of the test site the P signals sum constructively, whereas on E-W azimuths the signals sum destructively. This, they argue, biases the average mb low by 0.2 magnitude units (m.u.).
Since the velocity of P-waves in surface rock is typically 5 km/sec, the maximum time delay between the two signals is on the order of 200 milliseconds. If the azimuth of a measuring station from Pokhran is an axis at right angles to line connecting S-I and S-II then the path length is identical and the arrival time is zero. If the azimuth deviates from this axis by the angle theta then in general the arrival time difference is simply:
While simultaneously arriving signals should indeed add together, it is not clear that the model Sikka et al present for cancellation is correct. It may be questioned whether the waveforms of the two shots (different yields in different types of rock) would be identical as they present them; the specific correction factors they generate for different azimuths are model-dependent and are thus speculative. Other problems that this interpretation has is that since the signals are impulses - abrupt transients - not continuous signals the different arrivals should generate a precursor where only the first signal is present. Interference of any kind cannot occur until both signals arrive. This type of precursor has been largely absent from the seismic data that has been collected. There should also be differences in the signal depending on whether the larger S-I or the smaller S-II shot is the closer one. Finally, the overall seismic signal is a broadband signal with a long "tail", even though the principal energy-containing component is an initial transient with a frequency around 1 Hz. Interference effects should alter the waveform selectively at different frequencies, but this phenomenon has not been described.
The seismological community does not appear to accept the claims of Sikka et al. But it does not appear that any outside seismologist has yet presented a detailed analysis and rebuttal.
An early attempt at comparative signal estimates was made by Walter who cited data from a Canadian seismic station that measured both the 1974 and 1998 shots to provide a direct strength ratio measurement of about 2 [Walter et al 1998]. This implies a yield of 16 kt for P-II, given the 8 kt yield of P-I.
A more recent assessment of the subject was given by a group working at the Atomic Weapons Establishment in the UK [Douglas et al 2001], which has greatly improved the data set for comparative measurements. They developed a set of 12 stations that measured both P-I and P-II. Since the points of origin and measurement are eseentially identical, the direct measured signal strength allows scaling from yield estimates of P-I without complications from transmission path effects. By averaging all of differences between P-I and P-II (in m.u.) they arrive at a value of 0.37 m.u. Using Equation 1 (above) with b=0.75, as per Wallace, a yield ratio of 3.1 is obtained. With the yield claim of BARC this translates to 40 kt, but with the correct value of 8 kt it is only 25 kt.
The parameter that gives the strength of the seismic signal is known as log A/T (A is the displacement, and T is the period); the formula for calculating mb from log A/T is:
| Log A/T for the 18 May 1974 and 11 May 1998 Indian tests | |||||
|---|---|---|---|---|---|
| Azimuth | Station | Distance (deg) | P-I (log A/T) | P-II (log A/T) | Diff. (m.u.) |
| 3 | YKA | 90.7 | 0.8 | 1.5 | 0.7 |
| 16 | COL/COLA | 83.4 | 1.1 | 1.7 | 0.6 |
| 18 | PMR | 85.8 | 1.0 | 1.5 | 0.5 |
| 341 (19) | KEV | 49.9 | 1.4 | 1.8 | 0.4 |
| 330 (30) | NUR | 46.2 | 1.1 | 1.3 | 0.2 |
| 328 (32) | NBO/NB2 | 52.8 | 1.0 | 1.4 | 0.4 |
| 327 (33) | HFS | 51.2 | 1.3 | 1.6 | 0.3 |
| 145 (35) | HYB | 11.4 | 1.7 | 2.0 | 0.3 |
| 321 (39) | EKA | 59.7 | 0.7 | 0.9 | 0.2 |
| 313 (47) | GRF | 51.1 | 1.1 | 1.5 | 0.4 |
| 310 (50) | LOR | 56.0 | 0.9 | 1.1 | 0.2 |
| 256 (76) | BNG/BGCA | 55.5 | 1.6 | 1.8 | 0.2 |
By inspecting the difference column it is immediately evident that there is indeed a definite trend of decreasing magnitude difference as the azimuth moves away from due north or south. The four largest values are at the four smallest angles (3, 16, 18, and 19 degrees), and strictly decrease with increasing angle. The average of these four values is 0.55 m.u., the average of the remaining eight values is 0.325. The arrival time difference for the four smallest angles (assuming the S-I/S-II axis is due east-west) is 10 to 65 milliseconds. The remaining measurements have arrival times of 100 to 194 milliseconds.
The existence of this pattern does not necessarily indicate that the detailed model used by Sikka et al of adjust various measurements is correct. A more conservative approach would be to attempt to make a comparative yield estimate just using the four values with very small arrival time differences.
The temptation to take the measurement at YKA, with its small angle, as the "true" value should be resisted. It is clear from the other measurements in the table that there is substantial variability in the m.u. difference value from station to station, even when the azimuth and range are closely similar. Also the seismic estimates for YKA has been revised a number of times since 1998, both upward and downward (the Douglas value represents a new sharply higher interpretation) so that its value should be not treated as an absolute. Finally, one station that Douglas et al considered (MOX), which measure both P-I and P-II is not is not in the table since its m.u. difference was an unbelievable 1.4, indicating that one or both of the measurements were in error. Even the 0.7 m.u. value of YKA, when used to scale the 8 kt yield of P-I gives a combined yield of 69 kt, well above India's claims. Due to issues of measurement reliability, relying excessively on the measurement of any one station is inadvisable.
Taking the average of 0.55 m.u. for the four smallest angle measurement stations, we get a yield estimate for Pokhran-II of 43 kt with b=0.75. Using the value of b=0.77 used by Sikka et al the yield is 41 kt. Due to the fundmental limits of seismic estimates (exemplified by the spread in values used, 0.4 to 0.7, in a set of only four samples), significant uncertainty must accompany these estimates.
Significant refinement on these yield estimates requires additional information of test conditions or data from other sources than teleseismic measurements. As [Douglas et al 2001; pg. 72] observe:
The close-in information that might enable non-Indian scientists to improve their yield estimates is: the depth of firing of the explosions; the firing medium; and the water content of the medium, but none of this information seems to have been released.
A graph derived from close in acceleration measurements around the P-II test site is presented in [Sikka et al 2000; pg. 1365] that shows close similarity between the measured values at P-II and two Plowshare shots (Rulison and Rio-Blanco), when scaled to 58 kt. Unfortunately the measurement data itself has not been released for independent analysis, and the graph presented has no scale values for the acceleration axis. Without actual data this claim cannot be evaluated, much less confirmed.
An interesting comment by Chengappa may shed some significant light on whether the Shakti-I device truly performed as expected:
Some of the scientists looked worried. There was concern over whether the secondary fusion stage had properly detonated... Even Indian scientists like Iyengar, the former AEC chairman, doubted whether the test was fully successful.[Chengappa 2000; p. 431]. In April 2000 P.K. Iyengar went on record with the Times of India as stating that the secondary stage of this device was only partially successful, a claim subsequently denied by BARC.
Yield estimation by analysis of cratering morphology is complicated in the case of the Shakti tests since the precise burial depth is not known as of this writing. Chengappa gives a depth of the 'White House' shaft for the Shakti I thermonuclear device as "over 200 meters" [Chengappa 2000; p. 427]. A notable feature of this shot is the lack of significant surface disturbance, unlike the fission shot in the 'Taj Mahal' shaft and Smiling Buddha. Chengappa describes the effect seen by observers on the scene:
"The Taj Mahal site had a giant newly formed crater. But the hydrogen bomb site wasn't as impressive. A mound of several of several meters had risen and sheds all round it had collapsed in a crazy heap."[Chengappa 2000; p. 431]
The fact that the Shakti I shot was completely contained, and produced no subsidence crater allows some consistency checking, but without placing significant constraints on yield. The reported mound (not visible in available photographs) is not a retarc, such low relief structures are not infrequently produced by deep shots (see Fig. 6-f).
Chengappa reports that the Shakti I shot was fired in granite stratum at a depth of "over 200 meters". Since the shaft is only 1000 meters from the Shakti II shot (with a burial depth of "over 150 m" deep [Chengappa 2000; p. 422]) that was evidently not fired in granite the obvious interpretation is that somewhere below 150 m the porous rock used in Pokhran-I and Shakti-II is underlaid by granite stratum.
Using the scaling law and constants for granite found here it can be determined that a 43 kt explosion at a depth of 200 m (the limiting case) in granite would produce a cavity with a radius of 42 - 44 m, and a chimney rising 176 - 300 m (i.e. reaching the surface) given that the chimney formation would be through porous non-granitic rock. Since the near surface of the Pokhran site is composed of loose material (sand and perhaps alluvium) that cannot cap chimney formation it seems unlikely that a 43 kt shot at 200 m could have avoided producing a subsidence crater. If the depth was 250 m the cavity would have been modestly smaller 40 - 42 m, and the chimney height similarly reduced. This makes capping of the subsidence chimney plausible, though a crater could still have occurred under favorable circumstances. The combination of geological factors, depth and yield reported from Indian sources thus is consistent with the observed effects. The observed effects are also consistent with lower yields of course. The absence of a subsidence crater however effectively rules out a burial depth of only 200 m however with the reported yield.
By comparison the Shakti II fission shot, at 12 kt, produced a large subsidence crater in a shaft "over 150 m" deep [Chengappa 2000; p. 422]. If the depth were exactly 150 m the scaled depth would be 215 feet, consistent with the crater formation, though it could easily be deeper and produce the observed effects. The expected cavity radius would also be about 42 m, due to the shallower burial depth and softer rock, and the chimney would be certain to reach the surface. This is also consistent with the roughly 80 m crater shown here, since the radius of the chimney and subsidence crater is usually about the same as the original cavity (cf. Smiling Buddha above).
One radiochemical analysis of the thermonuclear device test has been published in the BARC newsletter, [Manohar et al 1999]. This analysis attempts to calculate the total quantity of fissions that occurred and thus the total yield of the device (a fission-fusion-fission system in which fission would dominate the total yield). The method chosen was to measure the vertical distribution of fission products and fusion neutron activated isotopes in two bore holes (one at the center, and one offset by 32 m). Then by assuming a uniform distribution out to an estimated radius of the final cavity (claimed to be 40 m +/- 4m) the total quantity of isotopes was estimated. The yield estimate obtained was 50 kt with a claimed uncertainty of +/- 10 kt.
Radiochemical analysis is commonly said to be the most accurate means of yield determination. But this statement refers to an entirely different type of radiochemical analysis from what BARC performed in this study. The most accurate method is to determine the percentage of material fissioned by comparing the ratio of fission products to fissile material in a sample, thus giving the efficiency directly and with knowledge of the weapon design (how much fissile material is present) the yield can be easily calculated. Unfortunately publishing such data also discloses weapon design information normally kept secret. Attempting to directly calculate the total amount of fission is fraught with problems in accurately determining the three dimensional distribution of the material throughout the collapsed blast cavity.
The data presented by India do not justify the claim of a 40 m radius uniform distribution for computing total activity. The two borings described only set a lower limit of 32 m, the claim for 40 m is based on an inference from the crush zone radius which was estimated to be 60 m (with unspecified precision). This does not provide a convincing basis for distinguishing between a 40 m cavity and one that is slightly more than 32 m. The 40 m radius does match the Indian a priori yield claim of 43 kt, raising the question of whether assumptions are being matched to desired conclusions. Replacing BARC's 40 m radius with 32 m in their computation would demote the yield estimate to 32 +/- 3 kt (using their specified 8% radioactivity measurement error) and bringing the lower yield limit down to 29 kt or so.
The determination that the cavity radius is at least 32 m does set a lower bound independent of seismic data. If the test depth were 250 m then the yield would need to be at least 22 kt to produce a cavity of this size. This lower bound is markedly higher than many of the outside seismic estimates offered.The Indians also reported having performed another type of yield determination test - CORRTEX, which is a sophisticated hydrodynamic measurement technique. The results of this test are not available.
Taking all these factors together, it appears that Shakti II is indeed about 12 kt as claimed. But Shakti I seems limited to about 31 kt, plus some margin of uncertainty that may bound it in the mid-30s. The various other data marshaled by BARC do not prove a yield larger than 29 kt, which closely matches the seismic upper limit of circa 35 kt as perhaps the most plausible yield for Shakti I. This would be consistent with a partially successful thermonuclear test with a roughly 15 kt primary stage and a 15 kt secondary yield.
The Shakti IV-V tests on 13 May are even more curious. India reported two shots being conducted with yield of 0.5 and 0.3 kt, but no outside seismic station has reported any evidence of tests on this day. The closest CTBT monitoring station was in Nilore, Pakistan 740 km to the north of Pokhran. This station is estimated to have sufficient sensitivity to detect a test at least down to 25 tons in Pokhran, yet no signal was detected. Wallace estimated that with standard seismic coupling, the test would have had to total no more than 10-15 tons to escape all detection. Assuming very poor coupling (and India's description of one test being conducted in a dry sand dune lends some support to this) allows yields up to perhaps 100 tons to escape detection, still far smaller than those claimed. The seismic signals detected for Pokhran-I and Shakti I-III provide a benchmark for evaluating the detectability of small tests. Even if India's claims of 12 kt and 43 kt are accepted for the two tests (thus indicating that seismic signals from this region are weaker than expected), the seismic signal of 800 tons of yield would be easily detectable unless extreme decoupling of both devices is assumed. Given the reported haste in shaft construction, and the unsophisticated shaft construction techniques used by the India Army, the use of deliberate decoupling measures seems ruled out.
Barker states that the yield of the 13 May event "was at least 500 times smaller than that of the 11 May event" and estimates an upper yield bound for these shots at 30 tons [Barker et al 1998; p. 1968]. But a footnote to this paper cites the description of these shots being fired in a sand dune region 10 km from the Shakti I-III site, and suggests that "under such conditions the upper bound of the 13 May test could be as alrge as 300 tons" but provides no explanation of how this new bound is obtained. Walter applies compensation factors developed at NTS for shots fired in poorly coupled media to arrive at a tentative upper bound of 100 tons [Walter et al 1998].
India has released an image of one of these shots showing a surface crater in a sand dune. The dune crater, judging by the sand bags in the image is quite small, perhaps 3.5-4 meters from rim to rim. The yield for producing this feature could be anything from a few hundred kg of explosive yield upwards, depending on the depth of burial and the mechanism by which the surface crater was formed.
In addition to this photographic evidence, BARC has published purported sample radiation measurements from all three sub-kiloton [Attarde et al 1999] test sites . Given the brevity of this article, and the lack of any substantive analysis, the apparent sole reason for this article's publication was to provide proof that they did actually occur. Accepting this evidence as genuine, at this writing no explanation of the anomaly of non-detection is at hand. BARC does not appear to have offered an explanation for this mystery. One possible resolution of this question is to postulate that Shakti IV-V were fired at the same time as the other Shakti shots. This contradicts all reports emanating from India however.
The consensus among outside seismic experts is that the yields of most Indian tests are overstated (particularly Pokhran-I or "Smiling Buddha" and Shakti-I), and that the very existence of Shakti IV-V is in question. Interestingly, the case with the Pakistani tests (conducted in a far different geological environment) is similar - claimed yields do not match the seismic evidence. No well-founded explanation is available for such a consistent pattern of deception by both India and Pakistan .